
Ornell Mubangwa, AfricaWorks, Agora Village, LUSAKA | 28 MAY 2026 — A 25-kilogram bag of breakfast mealie meal costs ZMW 235 in Kabwe and ZMW 400 in Chilubi, both cities in the same country, governed by the same economic policies, and measured in the same official statistics. That ZMW 165 gap, buried inside Zambia’s May 2026 Monthly Bulletin, captures something that aggregate national figures rarely surface, namely the distance between what a country’s data says and what its citizens actually experience.
Behind that price gap sits a broader story about how unevenly economic conditions distribute themselves across Zambia’s ten provinces and 116 districts. The May 2026 Monthly Bulletin presented by Ms. Sheila S. Mudenda, Statistician General of the Zambia Statistics Agency, contains several encouraging headline indicators, and while inflation is easing, the harvest outlook is strong, and the trade surplus has nearly quadrupled in a month, each of those findings carries a shadow that the aggregate figures do not immediately reveal.
A Cooling Economy, Unevenly Felt
The most immediately visible finding is the deceleration of inflation. The annual rate dropped to 6.6% in May 2026, down from 6.8% in April. Food inflation, which had been running at 7.3%, eased to 6.9%, driven largely by price movements in cereals and vegetables. “The annual overall inflation rate for May 2026,” Ms. Mudenda stated, “slowed to 6.6%, down from 6.8% recorded in April 2026.”
That figure, taken alone, suggests a stabilising economy. But provincial data complicates the picture considerably. Lusaka Province recorded the highest annual inflation rate in the country at 8.5%, contributing 2.5 percentage points of the national 6.6% figure on its own. Luapula Province, at the other end of the scale, recorded just 4.2%, with Luapula, Northwestern, and Western Provinces each contributing only 0.2 percentage points to the national total.
What this means in practical terms is that inflationary pressure in Zambia manifests unevenly across regions, the capital bearing a disproportionate share of the burden. The mealie meal price disparity between Kabwe and Chilubi reflects the same structural unevenness that the provincial inflation data makes visible.
Non-food inflation, meanwhile, edged slightly upward to 6.1%, influenced by rising costs in pharmaceuticals and fuel. Diesel prices recorded a monthly increase of 13.97%, reaching ZMW 33.94 per litre, a figure with downstream implications for transport, logistics, and the cost of moving goods between the very districts whose price disparities the bulletin documents.
A Trade Surplus with a Catch
On the trade front, Zambia recorded a trade surplus of ZMW 3.5 billion in April 2026, up sharply from ZMW 0.9 billion in March, as exports rose by 1.5% while imports fell by 9.3%. “Zambia recorded a trade surplus,” Ms. Mudenda noted, “of ZMW 3.5 billion in April 2026, compared to ZMW 0.9 billion recorded in March 2026.”
Canada emerged as the largest single export destination, accounting for 36.1% of total export earnings, of which 85.2% derived from copper anodes destined for electrolytic refining. Copper anodes and related intermediates collectively accounted for 80.6% of Zambia’s major export products, with traditional exports as a whole representing 64.4% of total export earnings in April. The concentration is significant in that Zambia’s revenue base rests heavily on a single commodity and a small number of trading relationships.
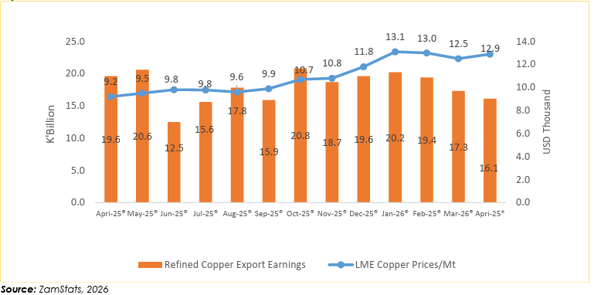
What makes the copper data particularly instructive is the divergence between global pricing and domestic earnings. Refined copper export earnings fell by 7.2% in April, despite a 3.1% increase in global London Metal Exchange prices over the same period. Ms. Mudenda’s figures point to a structural vulnerability that a rising spot price cannot automatically correct, and when volumes fall or product mix shifts toward less processed forms, the earnings benefit of a favourable market can be partially or wholly absorbed before it reaches the national accounts.
Congo DR ranked as the second-largest export destination, receiving sulphur as its primary import from Zambia, while Asia collectively absorbed 30.2% of exports and supplied 47.2% of imports. China alone accounted for 28.3% of the total import bill, and the top five export destinations collectively accounted for 80.3% of total earnings, a concentration that reflects both the depth of certain trading relationships and the limited diversification of Zambia’s export base.
Non-traditional exports offered a more encouraging signal, with earnings from that category surging by 20.9% to ZMW 9.0 billion in April and agricultural exports rising 17.3% to ZMW 2.1 billion. Tobacco led agricultural non-traditional exports at 31.5% of that sub-category. The cumulative data, however, carries a note of caution. Total trade for the first four months of 2026 reached ZMW 195.7 billion, representing a 9.5% contraction compared to the same period in 2025, and the structural dependence on road transport, which handles 96.3% of export value, leaves the trade network exposed to logistical constraints.
Fields Full, but Not Uniformly
The agricultural data is where the bulletin’s most striking contrasts emerge. The 2025/2026 Crop Forecasting Survey projects a 27.8% increase in maize production, with output estimated at 4,937,000 metric tonnes. Central Province leads projected production at over one million metric tonnes, while Northern and Muchinga Provinces recorded the highest yields at 3.3 metric tonnes per hectare. The National Food Balance Sheet, as Ms. Mudenda confirmed, “indicates an overall surplus of staple foods for the 2026/2027 marketing season,” a surplus estimated at a maize equivalent of 1,482,192 metric tonnes.
Rice production is projected to rise by 125% and soya bean output by 70%, figures that represent a meaningful broadening of the agricultural base with implications for food processing, export diversification, and rural income. Yet seed cotton has collapsed, with production projected to fall by 72%, the steepest decline among all major crops. Sunflower is down 44% and cowpeas by 43%, declines that signal acute distress in farming communities whose livelihoods depend on industrial and legume crops rather than staples.
Post-harvest losses add a further layer of complexity. An estimated 246,880 metric tonnes of maize, 5% of total grain production, will be lost after harvest, which means the surplus is a gross figure whose net value for smallholder farmers will depend heavily on storage infrastructure, market access, and the prices at which their grain is eventually sold.
What the Figures Say
ZamStats publishes its bulletin under the tagline “What do the Figures Say?” It is a question that rewards genuine engagement. May 2026 offers a Zambia that is, by several measures, performing well, with inflation cooling, the harvest strong, and the trade surplus widened. But the figures also speak to the geography of opportunity, the fragility of commodity dependence, and the gap between national averages and district-level realities.
The ZMW 165 difference in the price of a bag of mealie meal between two Zambian cities is, ultimately, the most human data point in the entire bulletin. It is the number that reminds the reader that statistics are not abstract. They are the arithmetic of lived experience.